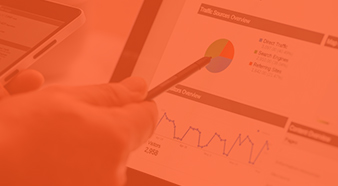
This report allows you to compare visually the performance of several keywords over time and adds a new angle to the analysis of a marketing campaign.
Usually, when viewing keyword performance from the Traffic Sources section of Google Analytics, it’s not possible to see a graphical depiction that compares individual keywords, although by clicking on the ‘visualise’ button above the graph, this is now possible. By doing this, keyword data can be analysed at a glance, over a specified time period. Any number of keywords can be selected and the time line can be moved to clearly see how particular keywords have performed over this period. For example, with ‘time’ selected on the X-axis and ‘visits’ on the Y-axis, a comparison of the number of visits each keyword has generated can be viewed and compared.
The parameters for comparison can be changed from visits to bounce rate, conversion rate, average time on site and more, so by selecting the ‘trails’ feature, the dots can be joined by a line, which shows the flow between them. The colour of the dots can also be changed to show the chosen parameters, which adds another dimension to the amount of data shown. To add yet more data to the comparison, the size of the dots can also be changed to represent any of these parameters. It’s therefore possible to see visits, bounce rate and average time on site over this period, and any other combination, including conversions and per visit goal conversion, which is a quick way to determine which keywords regularly produce the most revenue for a site.
The Motion Charts feature is a valuable tool for comparing different keywords’ performance on up to three parameters at a time. This enables a quick analysis of which ones are performing best and which are not doing so well, enabling the bids for those to be adjusted accordingly within Google Adwords. Over time, this quick comparison tool could lead to large cost saving within an advertising campaign.
This article was first published in the May 2009 edition of our monthly newsletter.
To find out more about Google Analytics and how you can use it effectively for your business, please get in touch for an initial, no obligation, discussion. Alternatively, if you are thinking of using website analytics for the first time, or have already started tracking your visitor data, we can provide you with a FREE analytics assessment to give you an idea of the key elements you should be tracking and reviewing to increase the performance of your website.


